
The Elephant in the Room of the "Potential" Massive Head & Shoulder Top
- Momentum Stock Alerts
- May 27, 2020
- 5 min read
As we noted before, our plan is to execute an 80-20 Apple short trade for the September expiration. We’re pretty close to executing part of that trade, notably the put spread position very likely this week. Again, of whatever is allocated to this trade…let’s say it’s $100k for example, 80% of that, or $80k, is designated to the short thesis while the remaining 20%, or $20k, is designated as a long position that’s sole purpose is to act as insurance in the even that the short thesis is compromised. The reason why that 20% long position is put on is because whenever AAPL gets to the extreme overbought conditions we’re watching for there is a very rare & slight chance that the stock can just keep ripping higher…but in the vast majority of historical instances whenever we get the alignment of such conditions it has nearly always meant that a larger correction / pullback cycle was right around the corner if not near immediately upon reaching such overbought conditions.
We're not the least bit concerned about the markets near-term as right now our bets are on the intermediate and long-term. There's a good chance we'll see some further upside, but after that we're very likely to see a massive retracement of epic proportions. It's an equal and opposite force of momentum in the market. Apple has just seen the greatest percentage gain over a 35-day period than at any other point in time since the bottom of the financial crisis. The same goes for the NASDAQ-100. Apple is up over 52% in just 35 days whereas the NASDAQ-100 is up 40%. When stocks move that quickly, there's a tendency to see an equally powerful retracement. As we noted, our expectation is Apple pushes down about 20% or so. From $330 a share, that would take the stock down to $265 a share. A mere 12-14% correction would take Apple down to $275-$290 from $330. As the SPY is concerned, I believe we've done a pretty good job reducing our cost-basis down to the low $20's and expect we will be able to produce a pretty good sized return on the next retracement. Notice that even a minor 10% correction puts the SPY down to $270 from $300. A 15% correction takes it down to $255. Notice that we're no longer even really betting on a 2nd wave or bad economic data. This is a bet on a regular retracement after an explosive rally. One we see virtually every time the market has a rally of this magnitude in such a short period of time. NO different than the Apple parabolic rally in Spring 2012 or any other near-term massive move. It's the short-term rate of change that leads to retracement. A Covid-19 second wave or the market waking up to economic reality is just icing on the cake. Neither of those things are needed. Even a recession isn't needed. The market and Apple are going to retrace given the size and scope of the move. We will just remain patient here and we will continue to trade around our current position on the SPY Jan $275 puts. We should have further opportunities to reduce our total cost-basis to under $20 with this move. Our goal will then shift to sell at $30 or a 50% gain on that eventual correction b/w now and January.
Here's something I wanted to point out & have wanted to point out for some time now. It's something that has been on the back of my mind and is now worth mentioning. There is a potential massive head & shoulders top developing in the market with a massive downside target. This thing is so massive it seems nearly impossible. A head & shoulders is always a possible set-up anytime we get the following THREE conditions which have occurred.
(1) we get a peak (left shoulder) at a new high followed by a major correction that bottoms
(2) an ensuing huge rally that takes the stock/market to significant all-time highs far above the previous peak forming the "Head"
(3) another major correction that takes the stock/market all the way back to the lows of where the left shoulder originally bottomed. If you get those three things to happen over any period of time, you have the potential for a head & shoulders set-up. When a stock sustains a correction, puts in a low, rallies to new highs and then has another correction bringing it back to the previous lows, that's a potential head & shoulders top. However, the head & shoulder is only really confirmed once we get a break below the neckline, followed by a retest to reclaim that neckline that fails to get back above the neckline. Historically there have been many fakeouts of head & shoulder tops specifically in secular bull market periods. They just get invalidated every time. However, there comes a time when they indeed playout & that's usually the transitioning from the bull era to the bear era. To invalidate that head & shoulders pattern, the stock/market must make new all-time highs. IF the market/stock peaks at ANY point below the previous highs, then you have the makings of the left shoulder, a head and a right shoulder. All that remains is a retracement back to the lows again. If that happens you have a completed head & shoulders top. We don't have a completed head & shoulders top yet. But if the SPY were to peak anywhere around these levels and then fall back all the way to the lows, the S&P 500 would be in real peril. Enough people would recognize this and it is actually precisely how things peaked in 2008 believe it or not. The 2003-2007 bull market peaked with a major head & shoulders top that spanned over 18-months. This one spans a little over TWO years which is appropriate given the side of the 2009-2020 bull market. The downside target of this head & shoulders top would be $130 on the SPY. The left shoulder sits at $280, the head at $337, the neck-line at $230. That's a $107 downside move on a breakdown below $230 or $130 a share. Take a look below here on this weekly chart (click to enlarge):
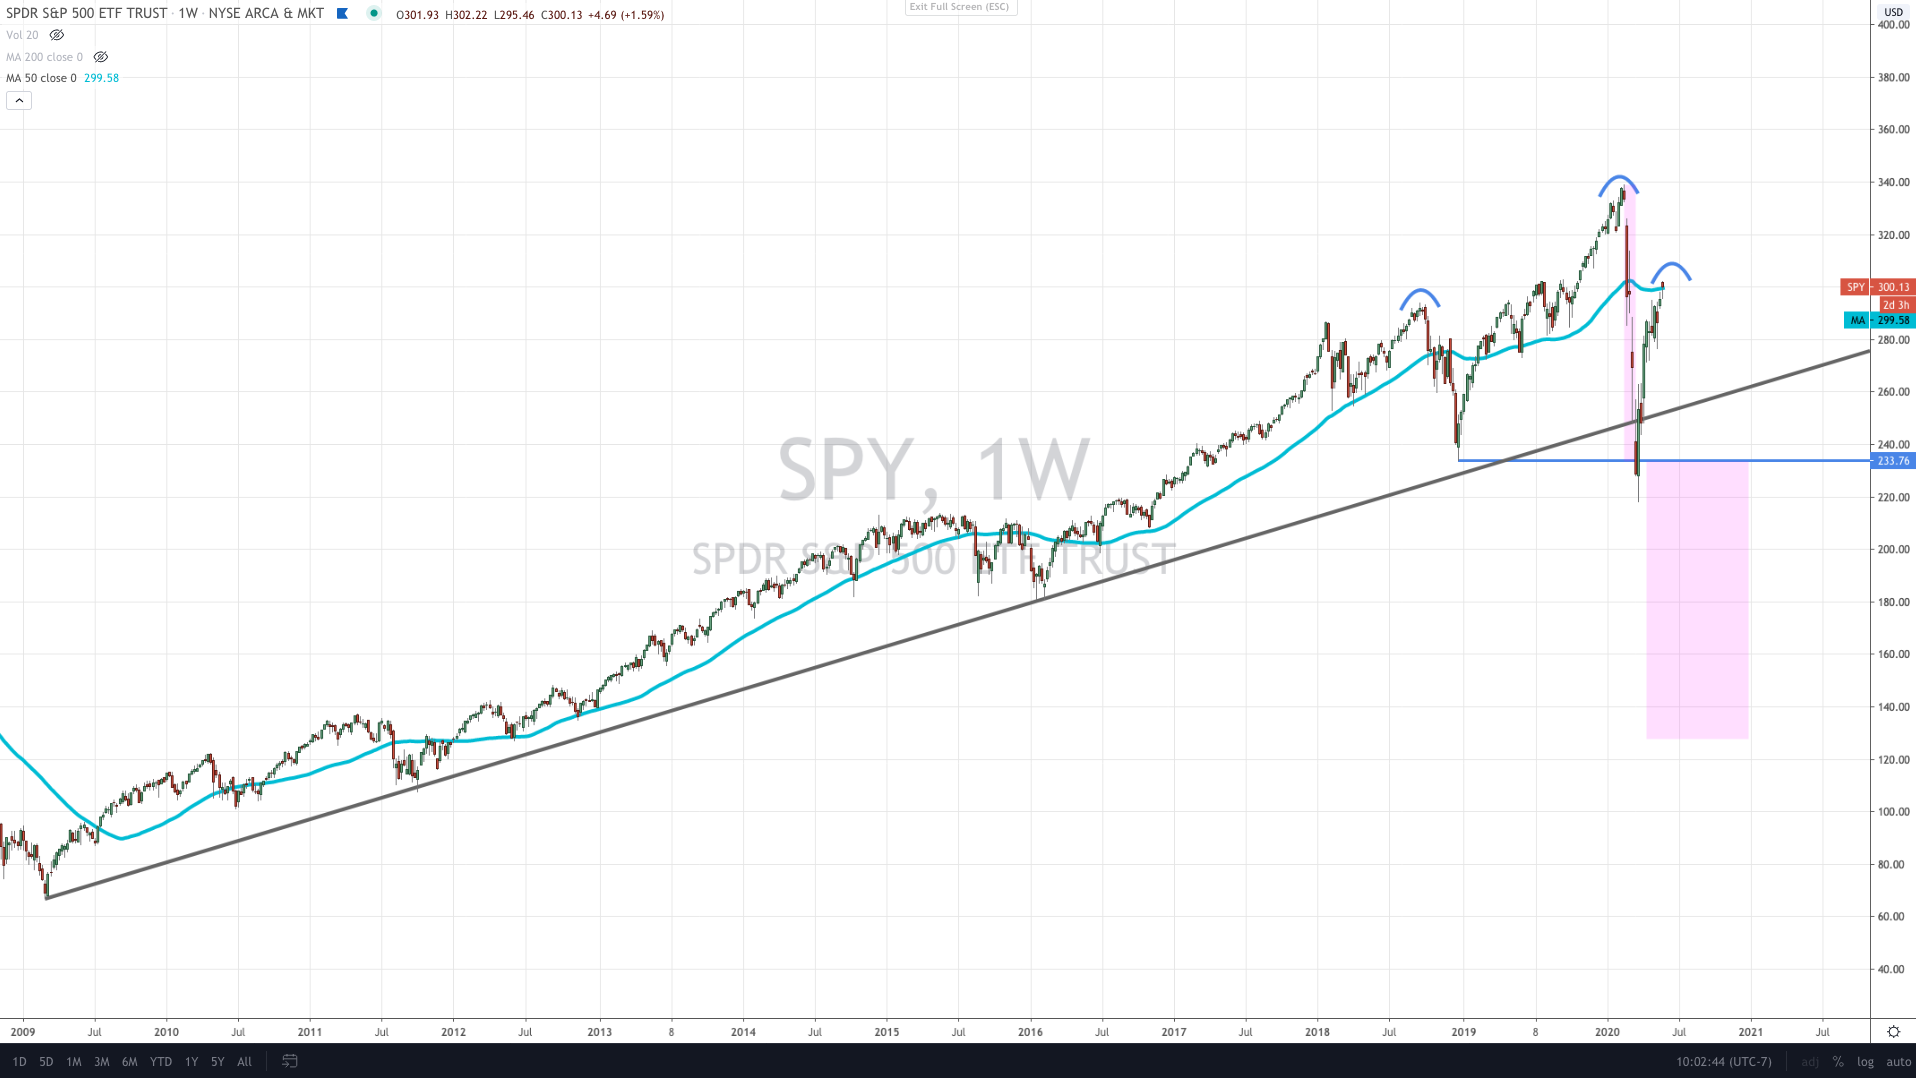
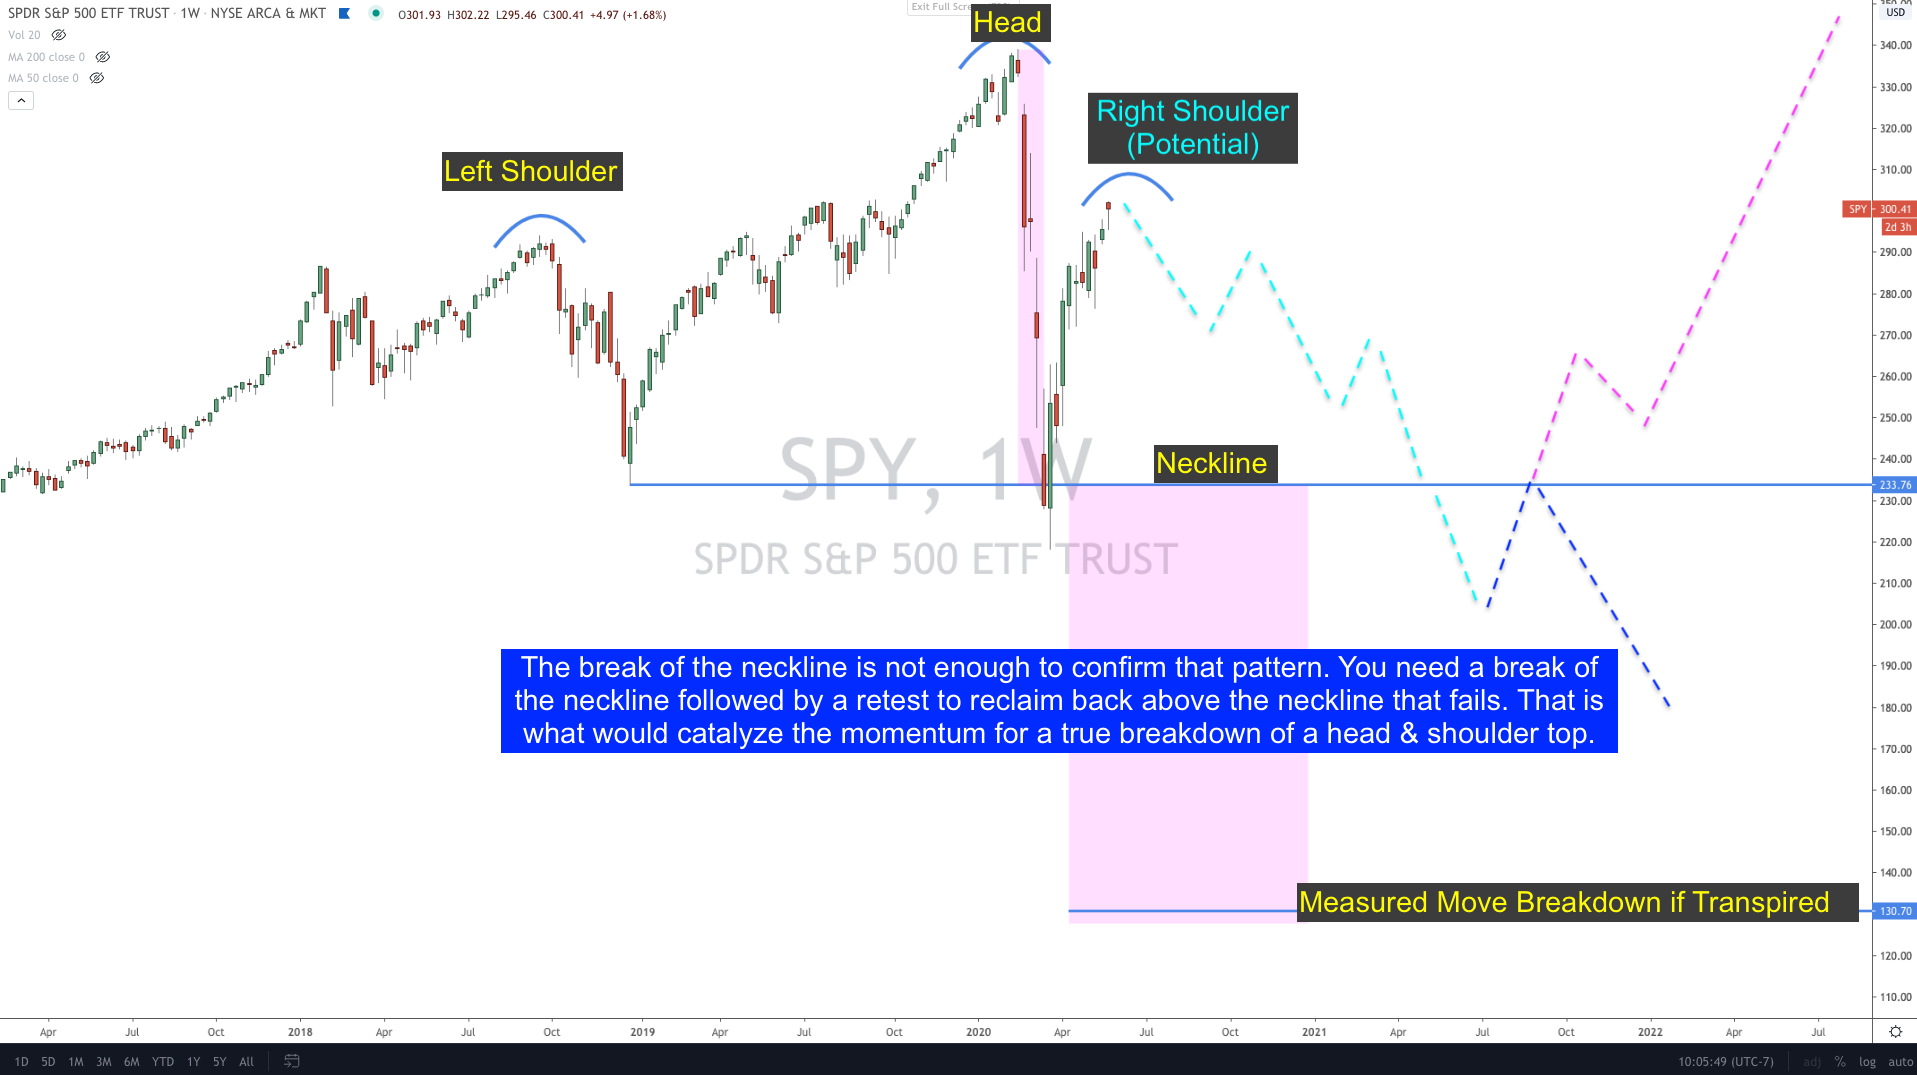
Zoomed in on that "potential" head & shoulder pattern here on this weekly chart (click to enlarge):
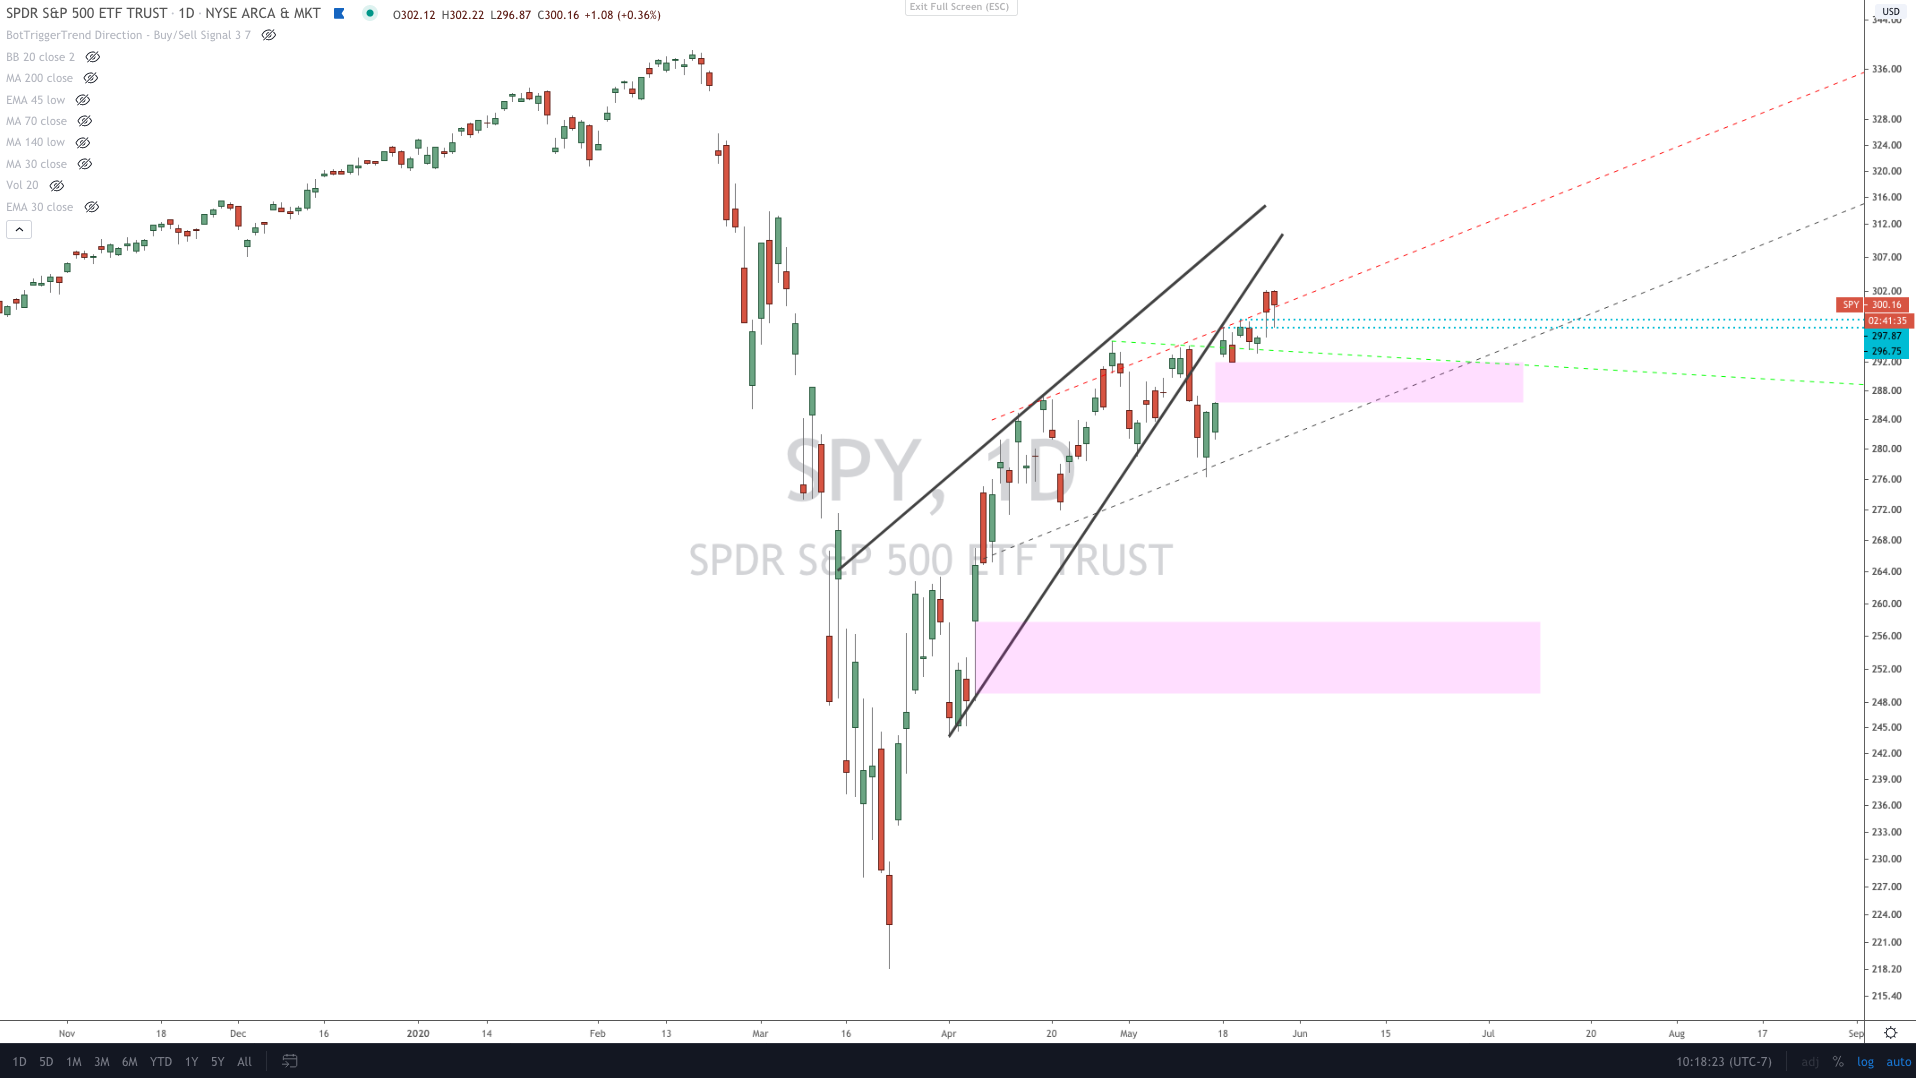
And lastly here is the updated daily view of that bearish rising wedge breakdown which is stil in the retest phase of attempting to reclaim momentum back above the wedge....clearing above & closing above the rising wedge on a weekly basis would effectively negate the bearish pattern as if it never existed. Either way, we put stock in these patterns because when they show up, there is always a high degree of probability that they play out with regards to their forecasted outcome:

Comments