

So our AAPL March 100/110 call closed the day trading at $9.22 today, which is about an +84% gain thus far. The chart above shows the actual options spreads value for the March 100/110 trading values. Notice that we only have about $0.80 cents of upside left on this spread which would yield an additional 8.5% upside left in this position before it caps out. We've been waiting for a pullback on AAPL that hasn't happened yet. We sold half of this position for a 62% gain back in mid December. And that's why we kept the other half as a hedge to protect us from further upside that we've since been able to capitalize on.Today Apple has seemingly broken out above a major area of resistance around $118.50 and has done so on above average volume that's come in consecutively for the last 2 days in a row. So this is some pretty strong action.

[Updated in blue] So something to point out that many miss is that straight call options trade differently then call-spread options. Call spreads that are "in the money" are cheaper when you buy more time, and thus have more upside. However, call-spreads are more expensive when you go farther out only when you're looking at "out of the money" positions. Now compared to straight call options...stand alone call options are just always more expensive whenever you buy more time...in the money &/or out of the money...call options are more expensive when you add time. So that's something to distinguish here.
The first table below shows the values of the 100/110 call spread trading at various months. Notice how when we buy more time the cost of the spread decreases and the gain potential increases, howbeit over a longer period of time.

And here is an out of the money call spread to illustrate what it looks for the same expiration months:
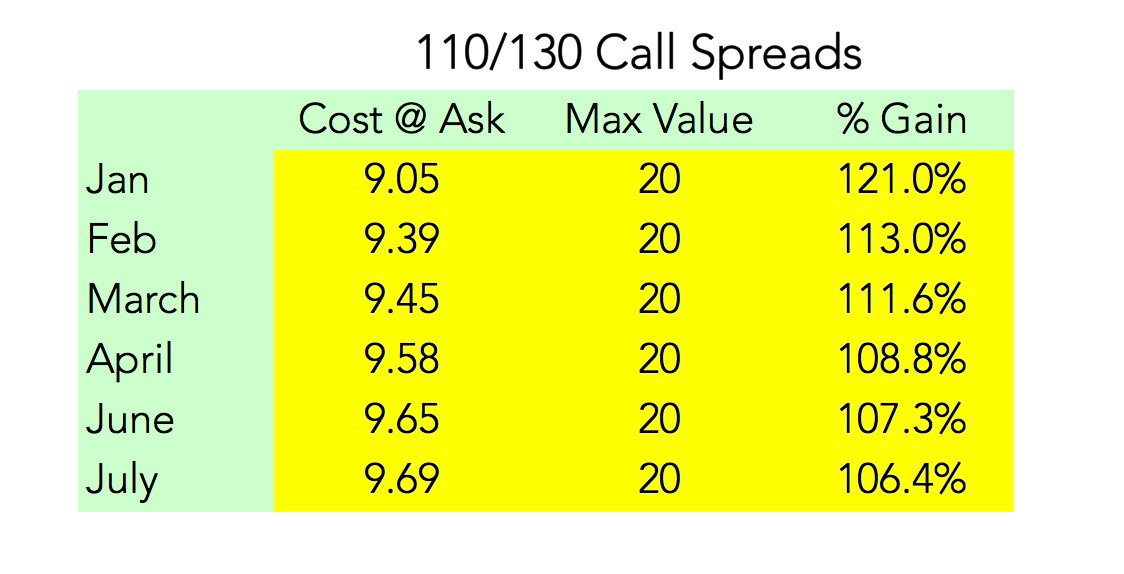
So although the July 100/110 makes about +20% more than the March, it would do so over a longer time frame...and well....wouldn't we like those gains sooner rather than later. So you get more time but on whole it took you longer to get there.
Now what we will be getting ready to do is to rotate out of the March position. Why? As we've been mentioning, the March 100/110 has a maximum value of $10 that can be achieved...it doesn't matter if AAPL goes to $200 per share by earnings, that spread can only be worth $10. And we're nearly at full value with the spread trading currently @ $9.22. So we have very little upside left in this position and with about 2 months in time value left...we want to get into a position that's both better hedged to give us more time and an increase in yield potential, yet able to do within a conservative framework in the event AAPL pullsback on earnings. We always want to model for a pullback.
Yet, I want to point something out about where AAPL is trading right now. This is entirely new trading behavior. We mentioned after October earnings that although AAPL sold off that it would most likely be trading in a new & higher trading range anywhere from 104 to 118. And that was entirely the case. Here are the following peak to trough trading ranges for the last 3 quarters, current quarter included:

So notice that every quarter the low is a higher-low and we're putting in a higher-high. But here's the thing...I think that after we close this current quarter, and once AAPL proves to take out the 120 range, that we will not ever see the low 100's again. The new trading low will most likely look like $115 to $135. The trading behavior has been too obvious and you're going to get a lot of chasers that cause an incredible rally as they get on board to take out the all time $134 high area.
So it may make sense to all together take a position in an new spread that is more in line with the 2nd table above showing the July 110-130 Call Spread. There is an opportunity to capitalize far greater than the 100% mark that modeled for with the March spread and we're going to go over that more closely as an alternative consideration than simply rotating into a July 100/110 call spread. The March 100/110 spread was deemed "conservative" when we took it back in September. But as we enter higher trading ranges, it begins to look "ultra conservative." Our goal in this setup was to model a trade that's both conservative but with the potential for oversized gains. And we pretty much got that with the March position. As we head into the new quarter it makes sense to adjust the ranges for a position that can really capture the bulk the rally but yet still afford a strong degree of conservatism. So a natural reaction is that the 110/120 range might be suitable...yet here's the thing....as I mentioned above....$120...once taken out.... will lead to an entirely different explosion in AAPL's rally potential. $120 is the old pivot high back in October of 2014 when AAPL took that out on January 2015 earnings. Once $120 was taken out we saw an explosive rally for about 6 months that topped out mid 2015. We can see something very similar here.

You're going to see a whole new level of positive sentiment come back into this stock as the media makes it the popular trade. Even if AAPL pullsback on this January earnings report, it will most likely be a short-lived pullback down to around $115 to $112 max downside. That pullback will cultivate yet another higher low. Ideally, we'd love to see that, if AAPL pullsback anywhere near $115 we will be initiating a new spread position somewhere in that area.
So our goal right now is to get into a new spread. We will sell the March 100/110 most likely right before earnings if we've continued yet more upside from now till then such as the July 100/110 spread as a holding position....at that point we will weigh out the advantages. If AAPL dips on earnings then we want to rotate into a a higher yielding spread like the July 110/130 as a temporary position with the intent to get into a higher yielding spread like the July 110/130. We want to hedge against 2 main things here:
1) If AAPL pullsback on earnings then the July 100/110 spread will go down less than the March 100/110 spread and yet afford us now more time for recovery. Again we believe even upon a dip that the March 100/110 spread is in the safe zone as AAPL will most likely close well above $110 by March either way.
2) If AAPL breakout on earnings, then we're now in the July 100/110 spread which will be able to capture more upside then the March position since the July 100/110 spread is cheaper by about a $1.25 right now and has about +20% more upside in gains then the March. Again, the July 100/110 would be a temporary position that we would be in with the intent to rotate into a higher yielding spread.
So that's the gist of what we're looking at. We will update Members as we things progress as we get ready for this rotation. Our goal here is keep getting +100% gainers framed with conservative frame works. In another post we will address the bearish thesis for good counter measure, but for now rest assured that AAPL is very much in bull mode.
